Building a HE marketing analytics dashboard in a week with Claude
The analytics setup was there. The time, skills, and budget weren’t. What happens when you build it anyway.

LSTM launched a new website in March 2026 — a project built with AI-mediated search in mind from the start, and one that surfaced some hard lessons about what pre-launch data can’t tell you. By April I needed to understand whether it was working as we planned. The data was there: GA4 configured, GTM live, Search Console verified. The gap was between the data and the insight. Which courses were attracting applicants? Where were researchers finding us? Was the organic search presence building? GA4 could answer all of it. It’s just not built to ask the questions a marketer needs to ask.
There’s a version of this problem sitting in most HE marketing teams. The analytics setup exists. The questions exist. What doesn’t exist is the time, technical capacity, or budget to close the distance between them. I’ve had that conversation more times than I can count. In April 2026, I stopped having it.
What building with Claude actually looks like
The way this gets discussed tends to mislead in both directions, AI building the whole thing, or the human doing all the real work and just using it to “write some code.” What happened was closer to this: I was the product director. Claude was the engineering team.
The product thinking, the UX instincts, the strategic decisions about what to measure and why, that was mine. I have a technical background, far enough out of active development that building this myself would have taken months. That background meant I could read the code, spot when something was architecturally wrong, and ask the right questions. Informed direction: close enough to the detail to be specific, removed enough to stay focused on outcome rather than implementation.
The stack: a Vite/React application connecting to the GA4 Data API and Google Search Console API, with Recharts for visualisation, running locally with OAuth authentication against our Google Cloud project. No backend. No database. No infrastructure to maintain. It loads live data every time I open it.
First message to working dashboard: one week (couple of hours a day).
Feature creep
The spec changed constantly. Every iteration revealed something we hadn’t thought to measure, or surfaced a limitation in how we’d framed the data, or prompted a question requiring a new source. Research theme page views needed filtering to LSTM’s nine specific themes. The course funnel needed to normalise two URL patterns WordPress was generating. Search Console data needed period-over-period comparison to be genuinely useful rather than decorative.
In a traditional development relationship, each of these is a change request. A scope discussion. Potentially additional cost. Certainly a delay. Here, it was another message.
The process absorbed the feature creep rather than fighting it. Not because iteration is free, my time has a cost, but because the friction of changing direction is so low that discovering what you actually want through using the thing becomes genuinely affordable. The dashboard now looks almost nothing like what I described in the first conversation. It’s significantly better. That’s how good products get built, and it’s usually something only well-funded teams can afford.
What we built
Three sections, each oriented around a different audience and decision type.
Recruitment tracks apply clicks and course sign-ups, with a course-level funnel showing page views, apply clicks, and conversion rate for each individual course. A cross-reference between Search Console organic performance and conversion data, which courses appear in search results, which are actually converting and geographic breakdowns specific to recruitment rather than generic session data.
Research covers newsletter sign-ups, research portal clicks, and page views broken down by each of LSTM’s major research themes. Which research areas are attracting digital audiences. Which represent content gaps.
Web is the Search Console integration, structured as a monthly narrative tool rather than a static data view. Period-over-period comparison across clicks, impressions, CTR, and position. A search intent grouping that classifies organic queries into Institutional/Brand, Student Recruitment, and Research, immediately showing whether organic traffic aligns with strategic priorities. Ranking opportunities: pages already in positions 6–20 with meaningful impressions, with an estimated click gain column for improved titles and meta descriptions. A gainers and losers view showing which queries moved significantly month-on-month.
The digest and what it actually costs
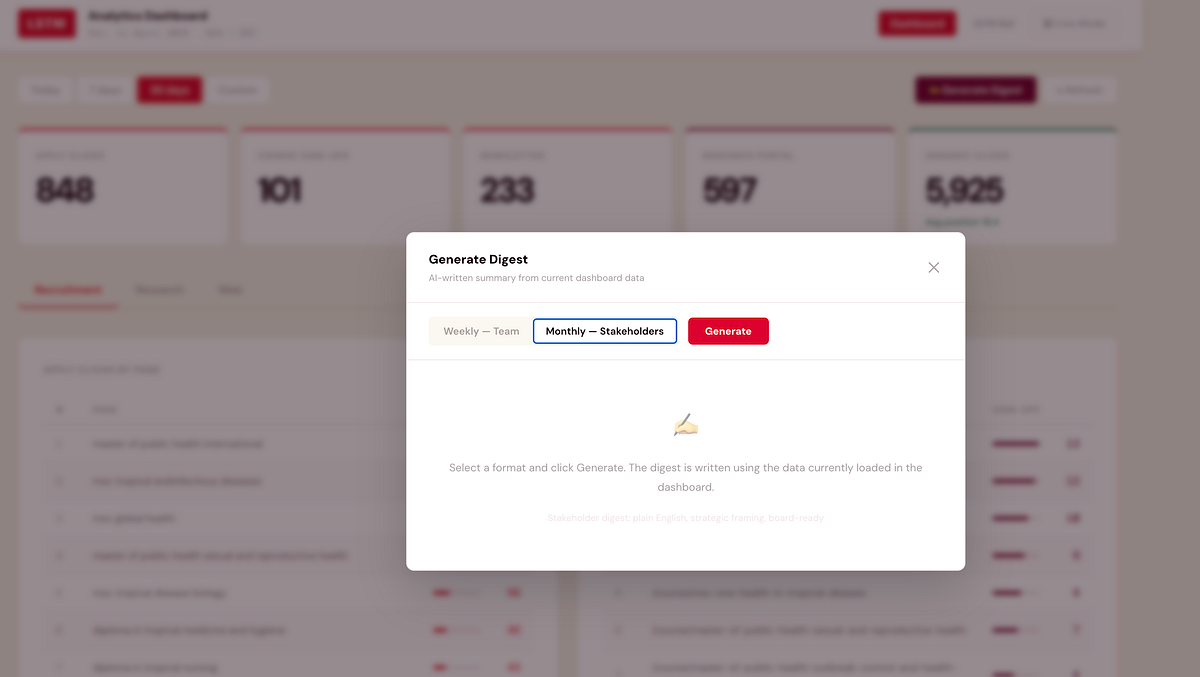
One of the later additions is the one I’m most practically excited about: a built-in digest that produces a written summary of current dashboard data via the Claude API.
Two formats. The weekly team digest is direct and action-oriented, written for colleagues who understand the metrics, structured around what moved and what to action. The monthly stakeholder digest translates the numbers into plain English for a vice-chancellor or board member who needs to understand performance without needing to understand analytics. Both pull from the data currently loaded in the dashboard: apply clicks, sign-ups, top courses, organic movements, opportunities. Both take about fifteen seconds and produce something you can copy directly into an email.
The cost: each digest uses approximately 800 input tokens and 600 output tokens via Claude Sonnet, at $3 per million input and $15 per million output tokens. Each generation costs roughly $0.01. Both digests, every week, for a full year: approximately $0.80.
Less than a first-class stamp. That’s the full annual cost of AI-written marketing performance summaries. The perception that API access is expensive comes from enterprise-scale assumptions. At the scale of one team, for a well-defined task, it’s essentially free.
External resource
We can’t hire our way out of the resource gap in HE marketing. Most institutions aren’t staffing a dedicated analytics engineer, a data visualisation specialist, and a digital marketing technologist alongside campaign and content roles. When external resource does come in, the relationship often struggles because the client side hasn’t done enough thinking to brief properly, so the first engagement is expensive discovery, the second is expensive revision, and by the third you’re starting to understand what you actually wanted.
A working prototype changes that completely.
When I bring in external support, a developer, a data specialist, an agency, I arrive with something concrete. Requirements aren’t a document; they’re a functioning application with known limitations and a clear direction. The brief is tighter because we’ve already discovered what doesn’t work through using it. External expertise concentrates on the problems that actually need expertise, rather than diluting across discovery I could have done myself.
Claude doesn’t replace external technical resource. It makes your investment in it go considerably further.
Where it goes
The dashboard is a few weeks old and already genuinely useful. The course conversion funnel is informing which pages need content attention. The research theme breakdown shows where organic traffic exists and where the gaps are. The Search Console comparison is directly informing content planning.
Near-term: targets on headline metrics so stat cards show progress against monthly goals rather than just absolute numbers. A deployed URL so colleagues can access it without running it locally.
Longer-term: three to four months of data makes period comparison significantly more powerful, and the query intent groupings can be refined against what’s actually appearing in results rather than what I predicted would appear.
Finished? No. But useful now, getting better, and the cost of changing direction remains low. That’s a better position than waiting for finished.
The technical detail
Stack: Vite + React, Recharts for visualisation, vanilla CSS via injected styles.
Data sources: Google Analytics 4 Data API (GA4 property 524788260), Google Search Console Search Analytics API, Anthropic Claude API for digest generation.
Authentication: Google OAuth 2.0 via Google Identity Services, with both GA4 (analytics.readonly) and Search Console (webmasters.readonly) scopes requested together at sign-in. Token stored in session only.
GA4 queries: Thirteen concurrent API calls on load — apply clicks by page, course sign-ups by page, newsletter sign-ups by date and page, research portal clicks, course page views (both /study/ and /course/ URL variants normalised to slug), research page views filtered to nine known theme slugs, research centres page views, country breakdowns for each conversion type, traffic channels, conversions by channel, and two referral source queries.
GSC queries: Nine concurrent calls, current and previous period for overview, queries, and pages (enabling period comparison), plus current period for devices, countries, and a broad page fetch used for zero-click detection and opportunity identification.
Digest generation: Claude Sonnet via direct browser API call with the anthropic-dangerous-direct-browser-access header. Prompt constructed from current loaded data, approximately 800 input tokens including summary metrics, top courses, top queries, gainers/losers, and opportunities. Output approximately 600 tokens. Total cost per generation approximately $0.01.
Deployment: Currently local (Vite dev server). Planned: Netlify static deployment with environment variables for API keys.
The dashboard is an internal tool built for LSTM’s marketing team. If you’re working on something similar in HE and want to compare notes, I’m on LinkedIn.